AI infographic generator tools are changing the way marketers, agencies, and content teams create visuals. With just a few inputs, AI can help generate clean, engaging infographics in minutes instead of days.
You don’t need advanced design skills. It makes the entire process faster, easier, and far more scalable. So which AI infographic generators are actually worth your time? Let’s find out.
Who These Tools Are For
| Who | How AI Infographic Tools Help |
| CMOs | Turn complex data into clear reports, campaign summaries, and internal decs that are easy to understand and share. |
| Agencies | Create pitch-ready infographics faster and scale visual content production across multiple clients without burning out design teams. |
| Brand & Content Teams | Repurpose blogs, whitepapers, and reports into engaging visual assets for websites and social media. |
| Founders & Solopreneurs | Transform insights, metrics, and ideas into professional-looking visuals for LinkedIn, pitch decks, and product storytelling. |
Comparison Table of AI Infographic Generator Tools
| Tool Name | Best For | AI-Strength | Ideal Use Case |
| Piktochart | Business and report decks | Content-to-layout AI | Internal reports, presentations |
| Canva | Flexible, creative infographics | AI-assisted design & copy | Social, blogs, mixed visuals |
| Venngage | Data storytelling | AI layout + data visuals | Reports, pitches, data explainers |
| Napkin.ai | Speed-first visuals | Prompt-based generation | Quick infographics from text |
| Gamma.app | Narrative visuals | AI-driven storytelling | Scrollable reports, web content |
| Adobe Express | Branded visuals | Generative AI imagery | On-brand marketing visuals |
| Visme | Data + customization | AI-assisted structure | Analytics-heavy infographics |
| Infogram | Live data visuals | Subtle AI, strong data | Dashboards, real-time charts |
AI Infographic Generator Tools
| Table of Contents |
| 1. Piktochart |
| 2. Canva |
| 3. Venngage |
| 4. Napkin.ai |
| 5. Gamma.app |
| 6. Adobe Express |
| 7. Visme |
| 8. Infogram |
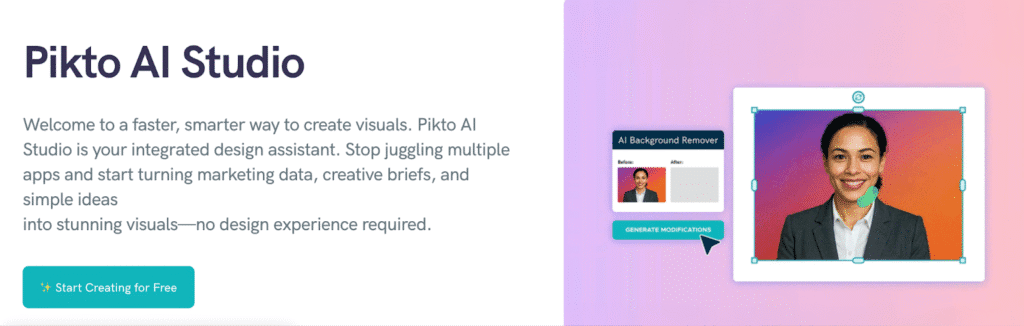
1. Piktochart
Piktochart is built for turning structured content into clean, professional visuals. It’s especially useful when you need infographic-style reports or slides that look presentation-ready without heavy design work.
Key Features:
- AI-Powered Layout Creation: AI assistant converts pasted text into ready-made visual layouts.
- Brand Consistency: Strong support for brand assets like logos, fonts, and colors.
- Business-Focused Templates: Templates designed specifically for reports, presentation, and internal decks.
- Quick Customization: Easy drag-and-drop editing for fast refinements.
Cons:
- Needs Finishing Touches: AI-generated layouts still need light manual customization.
- Limited Creative Freedom: Less flexibility for highly creative or experimental designs.
Review: Piktochart works best when clarity and professionalism matter more than bold creativity. For marketers and teams creating reports or decks at scale, it’s a dependable, time-saving tool.
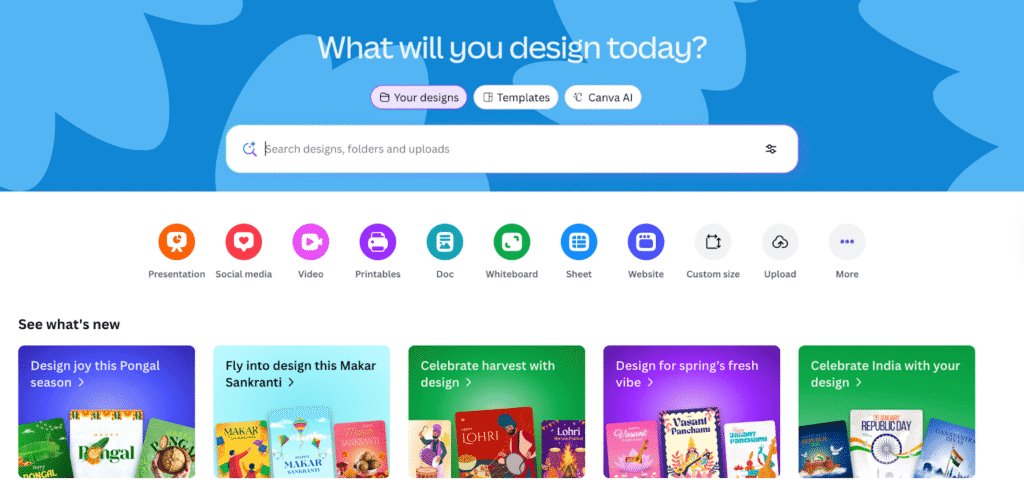
2. Canva
Canva has become a go-to for marketers and creators because it’s both powerful and easy to use. With its AI features stepping up recently, it’s now a strong contender for generating engaging infographics without needing advanced design skills.
Key Features:
- Huge Template Library: Thousands of customizable infographic templates for every use case.
- AI-Assisted Content Generation: AI tools help rewrite text, suggest layouts, and auto-fit content into visuals.
- Brand Kit Integration: Save brand colors, fonts, and logos for consistent visuals across assets.
- Multimedia Support: Add icons, illustrations, charts, and animation with intuitive drag-and-drop.
Cons:
- Can Be Overwhelming: The sheer number of templates and options can be a bit much at first.
- Not Always Automatic: Some AI features still require manual activation or tweaks.
Review: Canva is ideal if you want flexibility and creative freedom alongside smart assistance. It’s especially great for teams that design a mix of infographics, social assets, and presentations without jumping between tools.
3. Venngage
Venngage is built with infographics at its core, making it a solid choice for anyone who needs visuals that tell a story with data. It blends ready-to-use templates with smart tools that help you translate numbers into engaging visuals.
Key Features:
- Data Visualization Focus: Chart and graph tools that make complex data easy to grasp.
- AI-Assisted Design Suggestions: Smart layout recommendations based on your content input.
- Template Variety for Different Goals: Infographics for reports, pitches, social, and internal communication.
- Team Collaboration Tools: Share projects, leave comments, and work together in real time.
Cons:
- Steeper Learning Curve: Takes a bit longer to master compared with simpler drag-and-drop tools.
- Paywall Limit: AI and certain premium templates require a paid plan.
Review: Venngage is perfect when data and story matter more than speed alone. If you regularly turn stats and metrics into visuals, it gives you depth and polish, even if it takes a moment to learn.
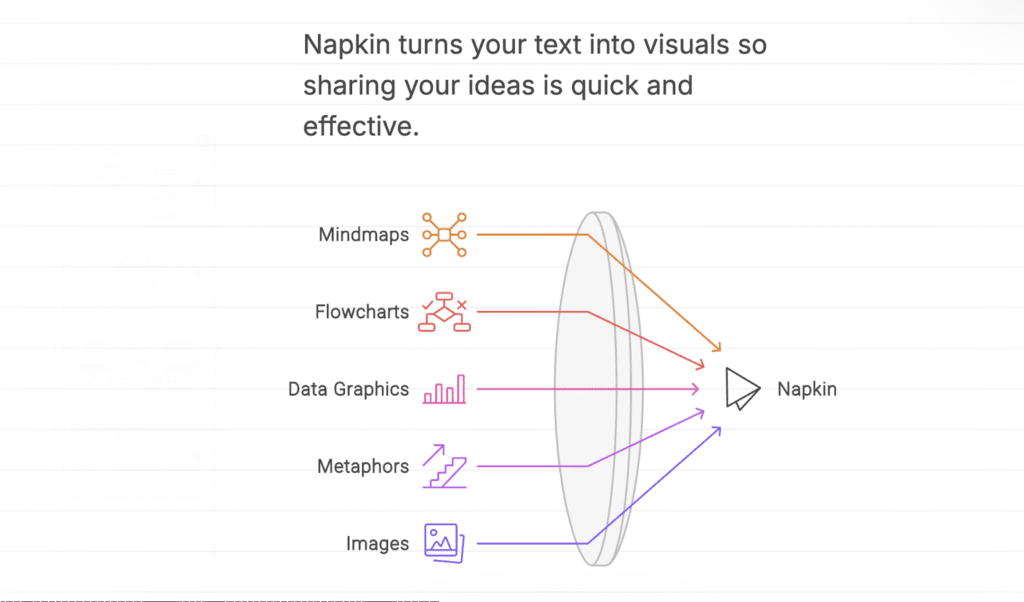
4. Napkin.ai
Napkin.ai is a newer, AI-centric tool that feels a bit like having a design assistant in your browser. Instead of starting with templates, you start with a prompt or text, and Napkin.ai turns it into a full infographic layout.
Key Features:
- AI-First Generation: Create infographics directly from prompts or pasted content.
- Conversational Interface: Chat-style inputs let you guide the design in plain language.
- Auto Layout & Visuals: Smart placement of icons, visuals, and sections based on content context.
- Export Flexibility: High-quality downloads ideal for presentations, blogs, and social posts.
Cons:
- Less Manual Control: You may need extra credits if you want highly tailored visuals.
- Fewer Advanced Data Tools: Best for narrative or descriptive visuals, not deep data visualization.
Review: Napkin.ai shines when speed and simplicity matter most. If you want usable infographics without wrestling with options and designs, it’s a refreshing and fast way to turn ideas into visuals.
5. Gamma.app
Gamma.app is an AI-powered visual storytelling tool that blends slides, text, and visuals into a single fluid canvas. It’s perfect for marketers who want infographics that feel more like engaging web-style narratives than static images.
Key Features:
- AI Narrative Engine: Turns text prompts into dynamic visual flows that adapt as you edit.
- Modular Canvas Design: Sections, cards, and scrollable layouts make complex ideas easier to digest.
- Rich Visual Media Support: Embed videos, GIFs, charts, and interactive elements alongside infographics.
- Real-Time Collaboration: Co-edit and share with teammates without exporting back and forth.
Cons:
- Lesser Traditional Infographics: If you want static, chart-centric infographics only, this feels broader.
- Can Be Overwhelming: The flexible design canvas takes a little getting used to.
Review: Gamma.app is ideal for marketers who want visuals that tell a story, not just communicate data. It’s part infographic maker, part dynamic presentation tool, and great for content that lives online or in scrollable reports.
6. Adobe Express
Adobe Express brings Adobe’s creative strength into a much simpler, marketer-friendly tool. It’s a good fit if you want AI-generated visuals combined with strong brand control, without diving into full-blown Photoshop or Illustrator.
Key Features:
- Firefly-Powered AI Visuals: Generate images, icons, and graphic elements using simple text prompts.
- Brand-Safe AI Generation: Firefly is trained on licensed and Adobe-owned content, making it safer for commercial use.
- Template-Driven: Ready-made infographic and social templates that are easy to customize.
- Seamless Adobe Ecosystem Integration: Works smoothly with other Adobe tools and assets.
Cons:
- Less-Infographic Specific: Not as laser-focused on data-heavy infographics as dedicated tools.
- Paid Plan Limitation: Advanced Firefly capabilities are limited on free tiers.
Review: It is ideal for teams that care deeply about brand consistency and visual quality. While it’s not a pure infographic tool, its AI-powered visuals and trusted Adibe backbone make it a strong option for polished, on-brand infographic content.
7. Visme
Visme is designed for marketers and teams who want more control over how data and visuals come together. It blends AI-assisted creation with deep customization, making it a good middle ground between automation and manual design.

Key Features:
- AI-Assisted Content-to-Design Flow: AI Designer turns prompts or text inputs into structured infographic layouts.
- Advanced Tools: Charts, graphs, and widgets suited for reports, dashboards, and analytics-heavy content.
- Brand and Style Control: Apply brand kits, custom fonts, colors, and layouts consistently.
- Interactive Elements: Add hover effects, animations, and interactive visuals to bring infographics to life.
Cons:
- Slight Learning Curve: More features mean it takes longer to get comfortable compared to simpler tools.
- AI Doesn’t Feel Fully Automatic: Best results come when AI suggestions are paired with manual edits.
Review: Visme is ideal if your infographics need to balance storytelling with detailed data. It’s powerful, flexible, and well-suited for marketers who want polished visuals without giving up control.
8. Infogram
Infogram is built for those who work closely with data. It’s less about flashy visuals and more about turning numbers, charts, and dashboards into clear, shareable infographics.
Key Features:
- Strong Visualization Capabilities: Create charts, graphs, maps, and dashboards with ease.
- Live Data Integration: Connect spreadsheets or data sources to keep visuals automatically updated.
- Clean, Professional Templates: Infographic layouts designed for resorts, media, and business use.
- Easy Embedding & Sharing: Embed interactive infographics directly into websites and articles.
Cons:
- Limited Creative Flexibility: Not ideal for highly visual or design-led storytelling.
- AI Features are More Suitable: Feels more data-first than AI-first compared to newer tools.
Review: Infogram is a great choice when accuracy and clarity matter more than design flair. If your infographics are driven by data and need to stay up to date, it’s dependable.
Traditional vs AI-Powered Infographic Workflows
| Workflow Type | How It Works | Impact |
| Traditional | Manual designs from scratch, heavy back-and-forth, limited iterations | Slow production, creative bottlenecks, and fewer experiments |
| AI-Assisted | Content-to-visual generation, quick edits, rapid iteration | Faster output, more testing, higher creative velocity |
The real advantage doesn’t come from making visuals faster. It comes from enabling teams to think, test, and communicate ideas without friction. When visual creation stops being a slow, manual process, experimentation becomes the default.
In the long run, AI-powered infographics will be a part of the core infrastructure that modern marketing teams rely on to move faster, learn quicker, and communicate better.
Check out our other AI design guides here:
- Must-Have AI Tools for Graphic Design
- 10 Creative AI Design Assistant Tools for Marketers
- AI in Design: Use Cases, Best Tools & Future of AI Design
FAQs
Light manual edits are usually needed for branding, clarity, and fine-tuning. Think of AI as speeding up 70-80% of the work, not replacing judgement.
These tools work well alongside blogs, reports, decks, and social workflows. You can repurpose existing content into visuals and export them for presentations, websites, or social platforms without changing your core stack.
Start with a simple use case like turning a blog post or report into a single infographic. AI-first tools are great for quick experiments before scaling.
They support designers, not replace them. AI removes repetitive setup and layout work, freeing designers to focus on strategy, storytelling, and high-impact visuals.
Disclosure – This post contains some sponsored links and some affiliate links, and we may earn a commission when you click on the links at no additional cost to you.